


Some childhood gaps are welcome news, like that of a gap-tooth smile. Achievement gaps? Not so much.
In This Lesson

What is the achievement gap?
What is the opportunity gap?
How are achievement gaps measured?
Which student subgroups score highest and lowest?
Are proficiency rates a good measure?
▶ Watch the video summary
★ Discussion Guide
What is an achievement gap?
An achievement gap is a durable pattern of differences in academic performance between groups of students. Commonly measured achievement gaps include standardized test score patterns by gender, by race/ethnicity, by socioeconomic status, and by degree of English fluency. In addition to test scores, academic achievement gaps can be measured using graduation rates, college-going rates, and course grades.
There are some good reasons to measure achievement gaps using standardized test scores. They are widely used and understood. They can reveal small differences or trends. They are comparatively quick and inexpensive. They also seem to correlate powerfully with variables that are harder to measure. Students with higher standardized test scores are more likely to persist in school, graduate, go to college, and succeed there.
Poverty strongly correlates with test scores. Students who qualify for free or reduced-price lunch services (not really a measure of poverty, but of low income) tend to score lower on tests than those who don't. Race/ethnicity correlates, too: on average, Black and Latino students tend to score lower on standardized tests than white and Asian students do. Achievement gaps are a symptom of a deeper issue — opportunity gaps — where a lack of generational wealth in low-income communities, especially communities of color, results in fewer educational opportunities for students. This term acknowledges systemic disadvantages.
How are achievement gaps measured?
Describing patterns of difference turns out to be more difficult than it might seem, even using test scores. After a student takes a standardized test like the CAASPP, California's state tests, a complex process grades the test using a >scaled score. It's more than just counting the number of questions you get right or wrong. Some questions are harder than others, so they are worth or weighted more than easier ones. Some questions are worth nothing because they are experimental.
A test score without context is meaningless, so test designers identify performance tiers, assigning benchmarks that indicate whether students have met expectations. California's system separates scores into four tiers.
Let's suppose that you and your twin sister each take a test, say the grade 5 CAASPP test in mathematics. Your sister scores 2,527 scaled points. You score 2,528—one point higher.
Your parents receive two envelopes in the mail with the score reports. Tearing open the first envelope, with warmth in their heart they learn that your score indicates "Standard Met." They open your sister's envelope, and the warmth fades. Alas, your sister's score falls short. It lands in the "Standard Nearly Met" range.
Of course, the one-point "gap" between these hypothetical scores is insignificant from a statistical perspective. If you both retook the test, your scores would probably be similar but not the same. Like free throws in basketball, there's skill involved, but a bit of randomness, too.
Randomness becomes less important when small samples like this are combined in larger numbers. The close calls on either side of the line tend to cancel one another out. Unfortunately, the statistics show that there are some big gaps.
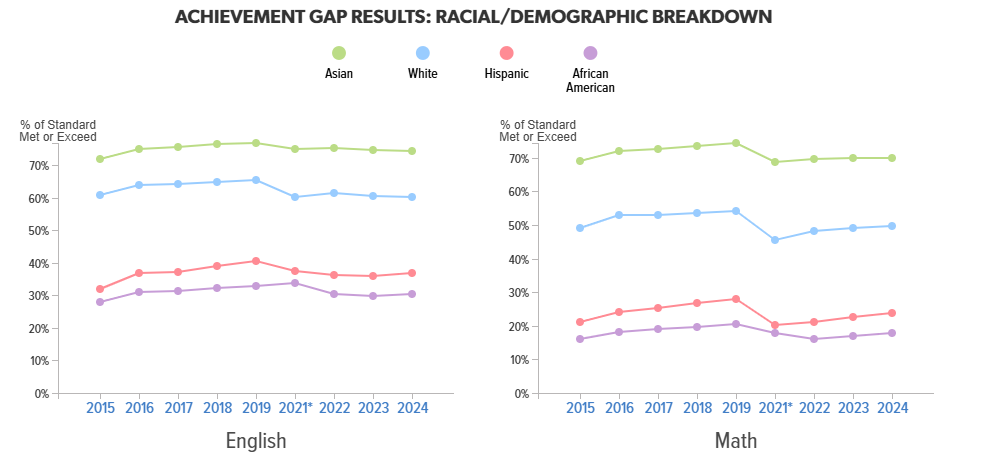
How big are the gaps?
They're big. Here's a comparison of CAASPP scores by subgroup for English Language Arts:
The gaps are big for math, too:
Are achievement gaps shrinking?
Achievement gaps have proved to be deeply durable. Change does happen, but it tends to take generations, not mere years or decades. For example, today girls tend to score higher than boys, a reversal. But gaps among racial/ethnic groups remain large. From 2014-2024, the pattern remained basically flat:
It could be argued that the years presented in the chart above were unusual. California’s grade-level standards and state tests were shifting to match the Common Core. There was a pandemic. Families got out of the habit of bringing their kids to school every day, no matter what.
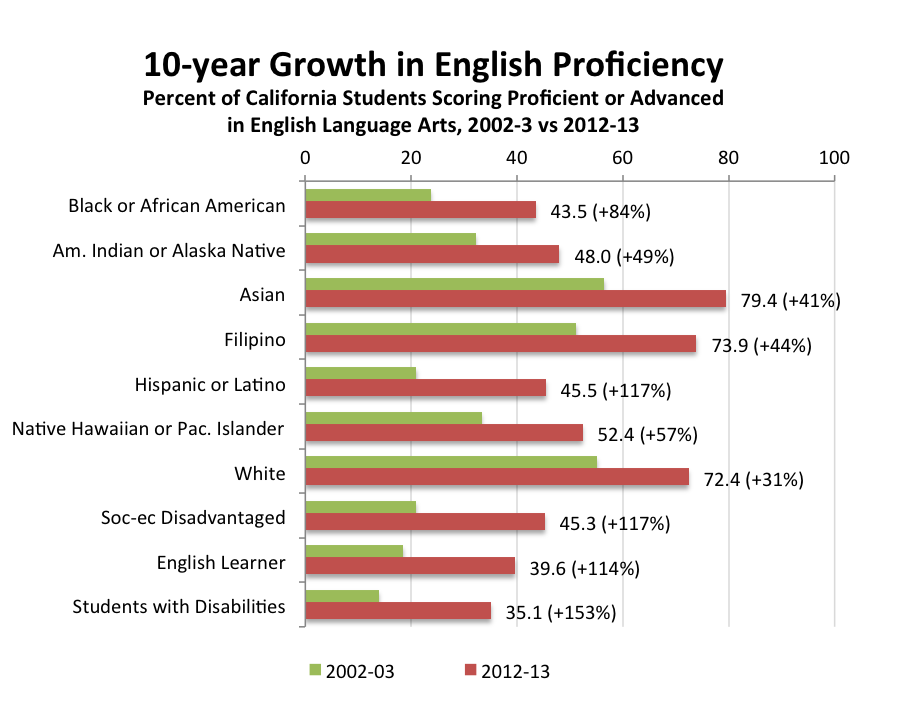
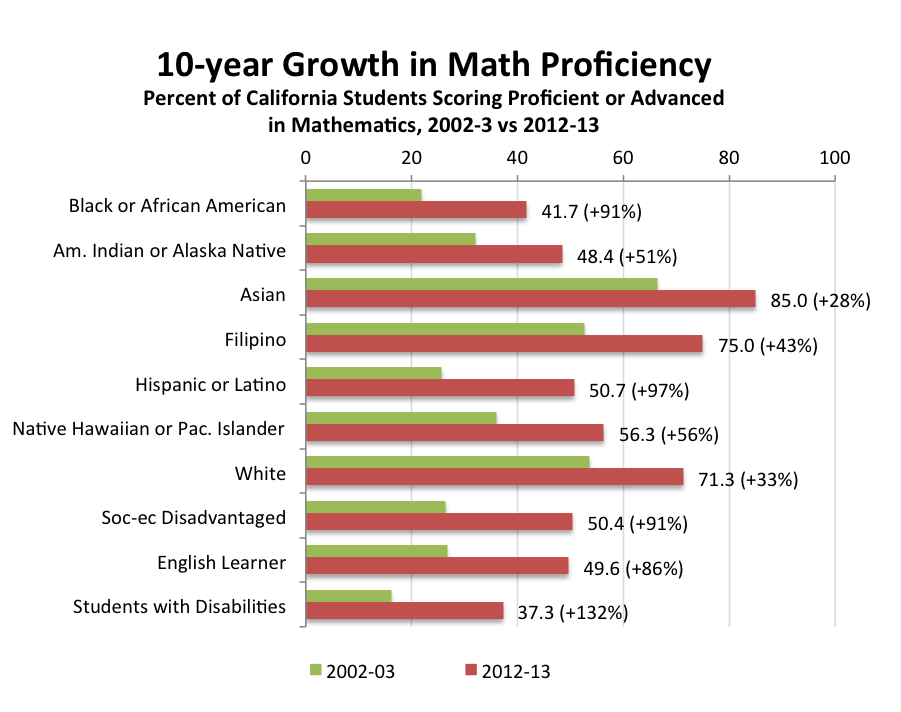
For the decade prior to 2014, California had used a different set of annual assessments, the California Standards Test (CST). During that period, tests showed a steady pattern of rising scores across all groups of students in both English and math.
 >
> Source: CA Department of Education. Click for additional detail
Taking the long view, educational optimists see the decade 2014-24 as a series of unfortunate events that interrupted a positive long-term trend toward proficiency for all students.
What is proficiency?
Academic proficiency means mastery of the subject-matter knowledge and skills specified for a student's grade level. As a practical matter, proficiency is defined by test scores. When looking at any chart that compares "proficiency" rates, squint a little. Remember, individual scores are pesky, detailed things. A little bump can push a score over the cutoff line between one achievement category and the next. Cutoff points are defined by a rule, not by a force of nature. They are supposed to represent a standard of achievement, not a relative position within a curve.
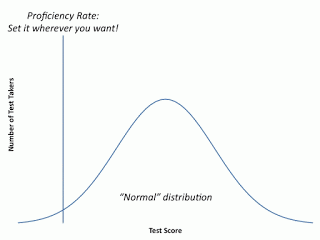
Education statistics are loaded with metrics derived from cut-off scores. By the nature of statistics, if a cut-off point stays put while a curve moves, metrics that describe how much of the curve falls above or below the cut-off point will highlight the significance of some changes while understating others. If the cut point is anywhere close to the steep part of the curve, a little bit of change can cast an exaggerated shadow.
Bell curves have two tails, and some critics argue that reducing gaps by boosting the learning of kids at the bottom of the learning curve isn't enough. They argue that long-term American competitiveness requires that a school's mission should include a focus on >gifted kids at the top of the curve, too.
The success of California's schools, districts, and public education system as a whole is often judged by how effectively they address these predictable gaps in achievement. The next lesson discusses the ways these systems' successes are measured.
Updated December 2024
Quiz×
CHAPTER 9:
Success
-
Success
Overview of Chapter 9 -
Measures of Success in Education
For Kids and For Schools -
Student Success
How Well is My Kid Doing in School? -
Standardized Tests
How Should We Measure Student Learning? -
College Readiness
Preparing Students for College and Career -
Education Data in California
Keeping Track of the School System -
Achievement Gaps
The Education System's Biggest Challenge -
The California School Dashboard
Measuring California School Performance -
College in California
Options After High School -
Paying for College in California
Are College Loans Good For Students?
Related
-
Educational Failure
The High Social Costs of Bad Apples -
Are Schools Improving?
Progress in Education -
Summer School
Time to Learn, or Time to Forget? -
After School Learning
Extending the School Day -
Attendance
Don't Miss School! -
Grade-Level Standards
What is the Common Core? -
Measures of Success in Education
For Kids and For Schools -
Education Data in California
Keeping Track of the School System
Sharing is caring!
Password Reset
Search all lesson and blog content here.
Login with Email
We will send your Login Link to your email
address. Click on the link and you will be
logged into Ed100. No more passwords to
remember!


Questions & Comments
To comment or reply, please sign in .
Carol Kocivar April 12, 2025 at 8:14 pm
"Refundable income tax credits — like the California Earned Income Tax Credit (CalEITC) and the Young Child Tax Credit (YCTC) — are proven tools that help families make ends meet. These credits provide direct cash support to Californians with low incomes, helping them afford essentials like groceries, rent, and child care. Our latest report highlights how California’s refundable income tax credits delivered $1.4 billion in financial relief last year. These credits reduce poverty and create long-term benefits for children, improving their health, education, and future earnings."
Carol Kocivar April 12, 2025 at 6:47 pm
Socioeconomic factors can explain a large proportion of racial achievement gaps.
“Children from higher SES families, who are disproportionately
White and Asian, have a head start in terms of acquisition of early reading skills, so their
better reading abilities show up early on the reading achievement measures. Over time,
those from lower SES families acquire these early reading skills, including while attending
school, and so the SES/racial gap narrows and begins to approximate those in the other
subjects.”
but the authors’ recommendations in the report—
particularly their suggestion to invest in early childhood education and to supplement families’
incomes, perhaps via an expanded child tax credit—deserve serious consideration.
https://fordhaminstitute.org/sites/default/files/publication/pdfs/explaining-achievement-gaps-role-socioeconomic-factors-final_3.pdf
Carol Kocivar December 6, 2023 at 3:12 pm
About 55% of students were deemed college ready in English in 2022–23, compared to 60% in 2016– Declines in math were similar, but levels of preparation are lower.
Demographic groups with historically lower college enrollment—Native American, Black, low-income, and Latino students, and students who have ever been categorized as English Learners (ever ELs)—were deemed ready for college-level math at lower rates than their peers.
Nearly two out of three Asian students (65%) were deemed ready, compared to 47% of Filipino students and 40% of white students.
https://www.ppic.org/publication/college-readiness-in-california/?utm_source=ppic&utm_medium=email&utm_campaign=epub
Jeff Camp - Founder November 16, 2023 at 12:36 pm
Carol Kocivar March 24, 2023 at 4:53 pm
https://edworkingpapers.com/ai23-742
Carol Kocivar July 5, 2022 at 2:42 pm
either. University of Pennsylvania graduate school of education.
https://www.gse.upenn.edu/news/rethinking-achievement-gap
There are similar findings on providing enrichment /advanced opportunities especially for low income and students of color.
Research Deep Dive: What we know about gifted education
https://fordhaminstitute.org/national/resources/education-gadfly-show-826-research-deep-dive-what-we-know-about-gifted-education
Carol Kocivar June 14, 2022 at 1:21 pm
(1) examines data on K-12 student achievement gaps,
(2) identifies funding provided for disadvantaged and low-performing students,
(3) assesses existing state efforts to serve these students,
(4) develops options for better supporting these students.
https://lao.ca.gov/reports/2020/4144/narrowing-k12-gaps-013120.pdf
Jenny Greene August 12, 2020 at 4:43 pm
Evan Molin February 22, 2018 at 5:25 pm
Sonya Hendren September 1, 2018 at 2:24 pm
NATHANIEL CAUTHORN February 22, 2018 at 1:04 pm
#sorrybutnotrealllysorry #@meifyoudare
Grace Thomas February 22, 2018 at 8:33 am
February 22, 2018 at 8:31 am
Emma Mechelke February 22, 2018 at 8:30 am
Brooklyn February 22, 2018 at 8:28 am
Abigail Hennessy February 22, 2018 at 8:26 am
VICTOR NGUYEN February 22, 2018 at 8:25 am
Connor Pargman February 22, 2018 at 8:24 am
Gloria Lucioni January 6, 2019 at 10:34 pm
Hannah Symalla February 22, 2018 at 8:21 am
Olivia Thomas February 22, 2018 at 8:12 am
g4joer6 April 22, 2015 at 11:38 pm
Sherry Schnell April 16, 2015 at 1:36 pm
Jeff Camp - Founder January 16, 2015 at 10:02 am
There are many perspectives on the purposes of testing students annually. Education statistical curmudgeon Bruce Baker argues that testing all students in search of statistical validity shouldn't be part of the motivation: https://schoolfinance101.wordpress.com/2015/01/16/the-subgroup-scam-testing-everyone-every-year/
sarah.chan April 4, 2015 at 9:43 pm
Gloria Lucioni January 6, 2019 at 10:39 pm