


What are Basic Aid districts?

Overflowing funds for schools?
As we’ve written regularly, California’s public schools are not generally overflowing with resources. Their cup does not run over. Oddly, though, overflowing is actually part of the design of the school finance system system.
Virtually all K-12 public school students in California attend a school funded by a mix of (mostly) state income taxes and (some) local property taxes. This mixed-source funding system, the Local Control Funding Formula (LCFF), serves about 96% of the students in the state.
About 4% of California students attend a school in a Basic Aid district. Here’s how that works.
Phased in from 2013-14 through 2018-19, LCFF replaced a complex and unfair school funding system with one designed for fairness and flexibility. The LCFF system is widely recognized as rational, explainable, and, well, good policy. Among other things, LCFF eliminated a bunch of regulation-heavy state programs, and empowered school districts to make more of the decisions about how to spend the money entrusted to them.
In 2022-23, just 3.7% of California’s public school students attended a school that is not part of the LCFF system. Basic Aid districts (also sometimes called Community Funded or Excess Tax districts) are the exceptions in the LCFF system. In these districts, the revenue from local property taxes is greater than the minimum guaranteed on a per-student basis through the LCFF calculation. In principle, these districts are self-funded, and might receive only a minimal amount of funding from the state — thus the term Basic Aid.
Did you notice wiggle words in the sentences above? Hmm. I’ll come back to them.
Did you notice the word might in the sentence above? Hmm. I’ll come back to it. Fair warning: this post spelunks some deep policy junk. I’ll do my best to get it right based on the data I have. (If I make mistakes, please contact me. This stuff is hard to get right!)
The point of this post is to demystify the Basic Aid system as a way of helping to understand what LCFF does and why it matters so much. It’s also interesting as a case study of how change actually happens, complete with the power plays and tradeoffs sometimes involved in getting to yes.
How does LCFF fund school districts?
You can’t appreciate LCFF without at least a little bit of context, so here’s some high-speed background. (Leans back, stretches.) OK, here goes:
The school funding systems that came before LCFF started out breathtakingly unequal, but got better over decades of change.
1960s:
In the 1960s and earlier, California public schools were funded almost entirely locally, using local taxes on local property wealth. This was deeply unfair, because the value of taxable property varied wildly from one school district to another. Low-income neighborhood with a low tax base? Sorry, kids. Better luck next decade.
1970s:
In the 1970s the system did change, and in a big way. Responding to massive inequity in school funding, the courts blew up the school funding system, Robin Hood-style. A system of court-ordered revenue limits redistributed wealth and sparked political fire. It was only a matter of time before…
1980s:
…yep, voters blew up the funding system again in 1978 by passing Proposition 13, which slashed property taxes. This sent school funding in California into a tailspin, so it was only a matter of time before…
1990s:
…voters intervened again by passing Proposition 98. It took form in the 1990s. Prop 98 established in the state constitution a minimum level for education spending when local and state spending is considered together. It’s ugly, but it rescued public education and we still rely on it.
In combination, these voter measures inverted the tax system, swapping property taxes with state income taxes as the main source of school funding.
To be clear, the system that emerged in the ‘90s worked, but it was a Frankenstein monster. Features of the system included revenue limits, categorical programs, precedents, line items, exceptions and plenty of special deals. Reform-minded people hoped it might just be a matter of time before…
2010s:
…a crisis brought a chance to make a more purposeful system. The Great Recession trashed education funding and delivered the opportunity of a long-needed crisis. Partly responding to good advice from a nonpartisan expert panel (the Governor’s Committee on Education Excellence) the legislature blew up the system again in 2012 — in a good way. In place of the old system, California leaders instituted LCFF, a much more rational and fair education finance system assembled with far fewer sloppy sutures and neck bolts.
Only a few, in fact. (Yes, yes, be patient. We’ll get there, I promise.)
Um, what does LCFF do, again?
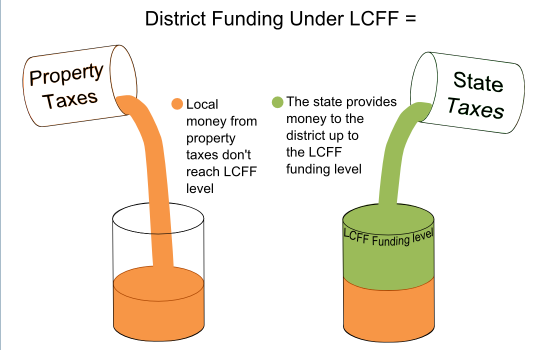
Here’s a simplified bucket metaphor for the Local Control Funding Formula system.
- The state budget gives your district a bucket of LCFF revenue that’s just the right LCFF size for your LCFF district.
- Local property taxpayers pour in property taxes, partly filling your LCFF bucket. (37% for the average district in 2022.)
- The state adds state taxes until your LCFF bucket is full to the brim, like this:
Does this look too simple? Of course it does. Let’s fix that a little but stay with the metaphor. Time for some fine print:
- The size of your district’s LCFF bucket is a factor of the state budget.
- Your bucket is a little bigger to the extent that you have more kids in higher grades.
- Also to the extent that you have students in poverty, learning English, homeless, or in foster care.
- Also the bucket is sized up if you have lots of kids with any of these attributes — but don’t count ‘em twice.
- Oh, and funds evaporate from the bucket to the extent kids don’t attend school — they only count when they show up.
But this is a metaphor, and it’s simplified, remember? The big point is that as an LCFF district, what matters is the size of your LCFF bucket, not the mix of funding sources that fill it. State? Local? Doesn’t matter — dollars are dollars.
What’s different about funding in a Basic Aid district?
Continuing with the metaphor, Basic Aid districts have a standard LCFF-sized bucket, but they have more than enough local revenue to fill it themselves, without state help.
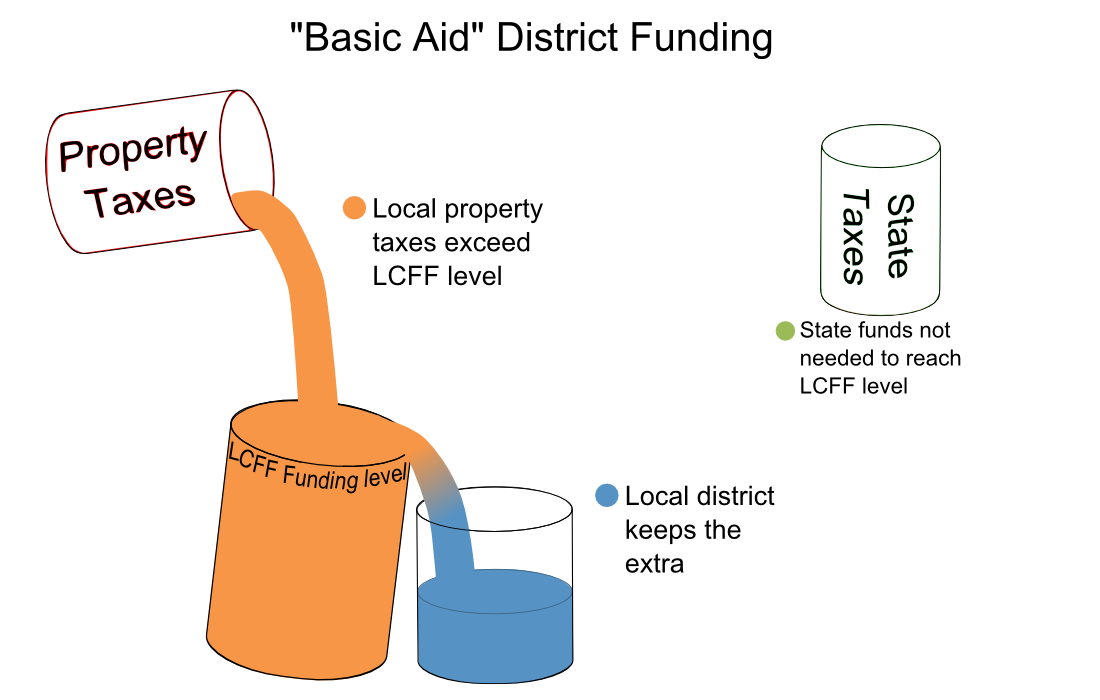
The local property taxes collected for K-12 at a Basic Aid district would overflow an LCFF-sized bucket, so basic aid districts have their own buckets to keep the extra. Local property tax dollars at a Basic Aid district stay local, even when they exceed the LCFF level.
Remember all the fine print about how LCFF districts get a little extra money for this and that, but only if kids show up for nose count, etc? None of that matters at a Basic Aid district. The budget for a Basic Aid district is determined by how much property tax comes in. That’s pretty much it, mostly. (Notice the wiggle words? Stay with me.)
Being a student in a Basic Aid district is generally a good thing for students but not automatically so. Some Basic Aid school districts bring in property taxes at a level that puts them only marginally or intermittently over the LCFF line, so it’s not like they are definitely getting a bunch of extra money. In a downturn, these districts worry, with reason, whether they would receive emergency support from the state or federal government. They tend to be extra careful about saving adequate rainy-day reserves locally. Many Basic Aid school districts are located in the most expensive areas of the state, so they are not without fiscal challenges.
And yet. Some schools in Basic Aid districts have money other school communities can only dream of. Some of them have even more than that… if they also get Minimum State Aid. (You have now arrived at the heart of the mystery.)
What is Minimum State Aid (MSA)?
The LCFF system wasn’t born like Minerva, fully-formed and shining like justice. It is a surprisingly decent outcome of messy political processes. The bad old system that preceded it (Revenue Limits, Categorical Funds and backroom deals) wasn’t equally bad for everyone. For some districts it was pretty good, actually, so why would their representatives vote to change it?
A deal’s a deal, right?
A spoonful of sugar called Minimum State Aid (MSA) made the medicine go down.
With the help of advisors including Mike Kirst, Governor Brown negotiated a set of financial agreements to protect districts that stood to lose out in the transition to LCFF. Minimum State Aid was a mechanism to get that done. By agreeing to support LCFF, some legislators secured promises for ongoing state aid for their constituents’ schools. The commitments are still in place. Hey, a deal’s a deal, right? In 2022-23, minimum state aid commitments to school districts totaled about $125 million.
Where does the extra money go?
The map below shows all of the unified (K-12) school districts that receive Basic Aid and/or Minimum State Aid. Most are located in the Bay Area, in coastal counties or in the Sierras. This pattern has been stable for decades. A map of the state’s Elementary districts or High School districts would show a similar pattern. (Hover or click for details.)
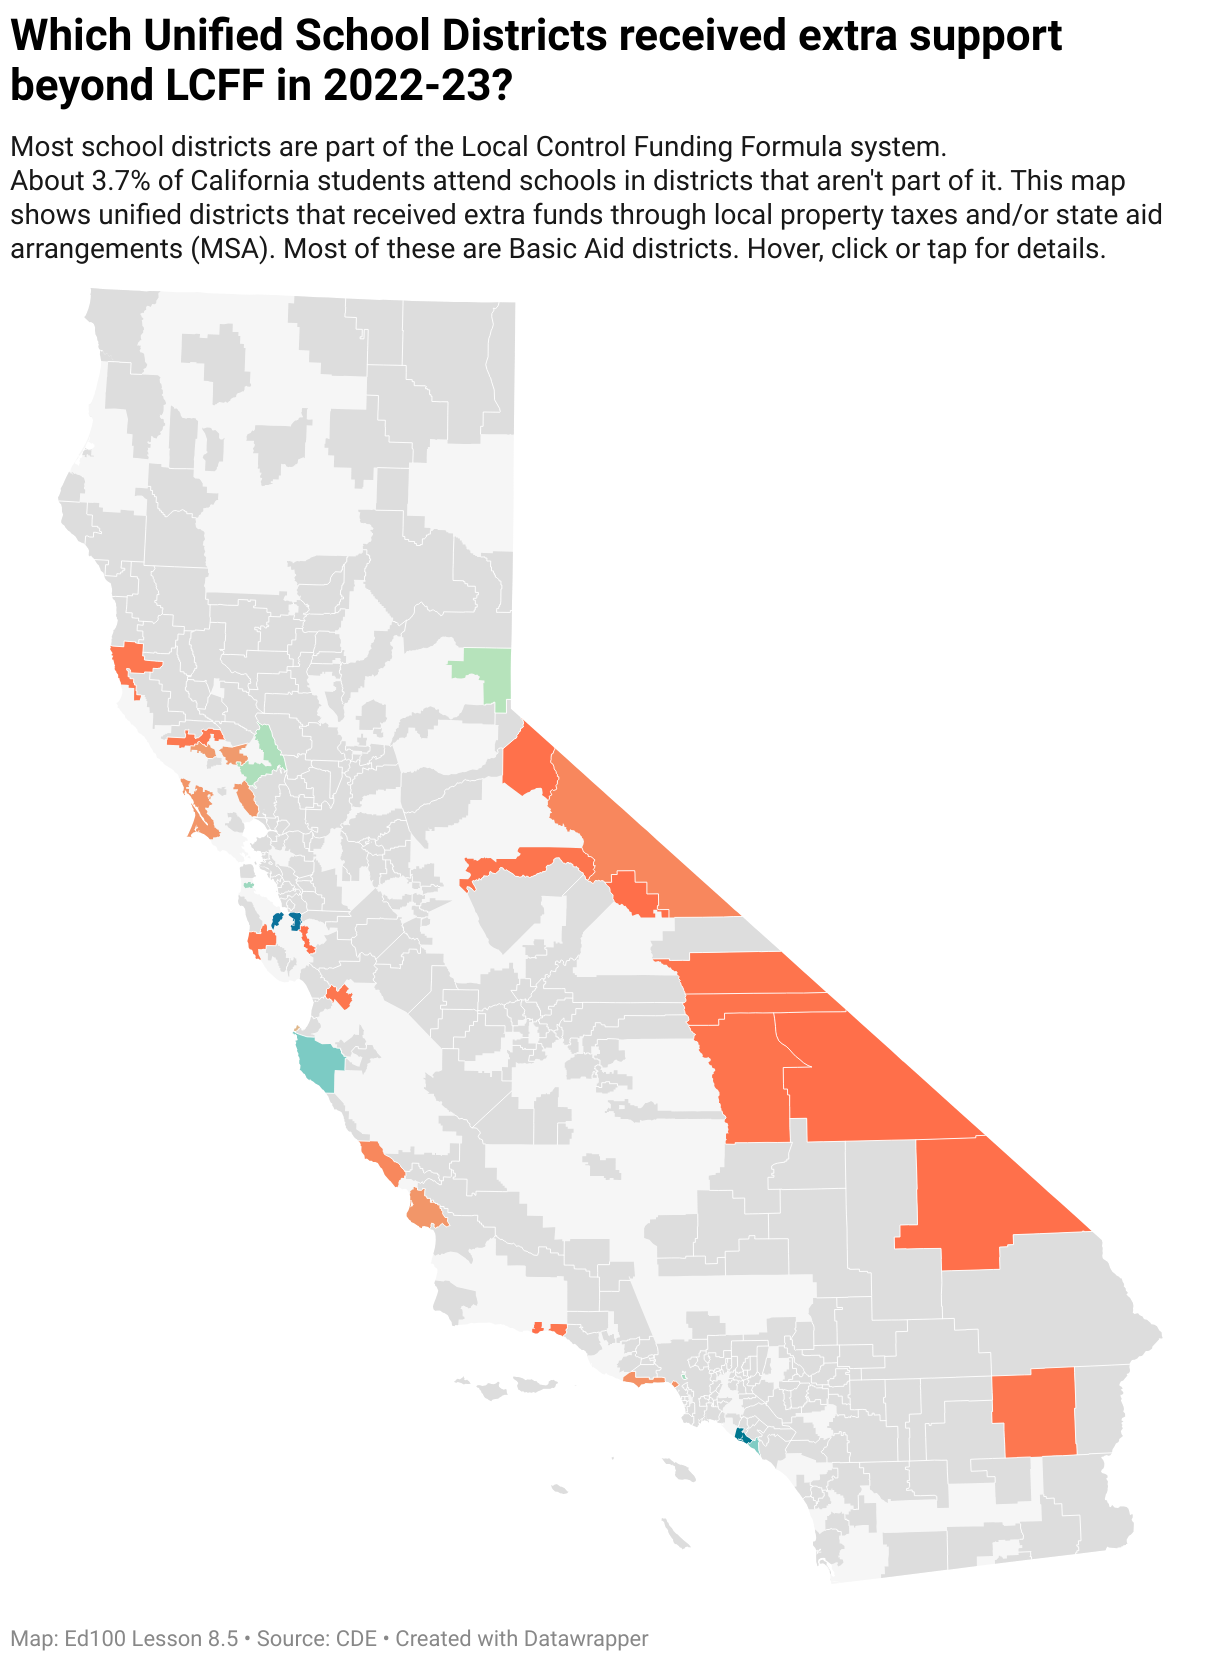
The map effectively shows which unified districts receive money, but doesn’t make it very obvious just how significantly some of the school districts in the Silicon Valley benefit from the extra local and state funds. Basic Aid schools in the high-cost Santa Clara and San Mateo Counties receive thousands of dollars of extra funds this way. Collectively, they serve more than 100,000 students.
About two-fifths of the students who benefit from either or both kinds of extra aid are in unified school districts.
|
District type |
Students (ADA) |
Districts |
Local extra funding |
Local extra per student |
State extra funds (MSA excl. COEs) |
State extra per student (MSA excl. COEs) |
|---|---|---|---|---|---|---|
|
Elementary |
76,487 |
70 |
328,470,002 |
4,294 |
56,744,650 |
814 |
|
Unified |
94,004 |
30 |
603,105,494 |
6,416 |
56,744,650 |
951 |
|
High School |
53,666 |
12 |
306,272,897 |
5,707 |
19,740796 |
651 |
|
Total |
224,157 |
112 |
1,237,848,393 |
5,522 |
125,782,845 |
832 |
Should the system change?
Some will look at this data and feel jealous of the districts that have more money for their education system. Certainly, the system of MSAs is the outcome of politically-negotiated deals. But that’s not the point of this post.
Similar to public K-12 school districts, most public community college districts in California are funded by a blend of local taxes and state taxes. (The Student Centered Funding Formula, or SCFF, strongly resembles LCFF.)
Also similar to K-12 and LCFF, some college districts receive enough local funding to be Basic Aid institutions. As of 2024, the Basic Aid public college districts in the state strongly matched the self-funded K-12 districts: San Mateo, Marin, Mira Costa, South Orange, West Valley/Mission, San Jose/Evergreen, Napa Valley, San Luis Obispo County, and Sierra.
The LCFF system is an astonishing achievement of public policy, accomplished in the real world. It works very well for most of what we ask of it. Anyway, clawing funds away from places where they are being used to educate kids seems a waste of indignation.
I grew up in the bad old days of California education policy. The education finance system at that time was bananas. It was a murky mess so unfair that it was hard to feel good about putting more money into it. Today, we’re in a much better place. When incremental money flows to public education in today’s K-12 system, by design it goes toward need, not greed.
There’s plenty of room for improvement in California’s education system, but the basic finance system is sound. With more economic effort to invest in our state’s schools, we could reasonably expect good results.
California’s basic aid districts and MSA recipients
In the table below, the “UD%” column shows the unduplicated percentage of students who are learning English, are from lower-income households, are homeless, or are in foster care. Statewide, 57% of students meet this definition. In Basic Aid and MSA recipient districts the rate is 32%, but it varies from 1% to 94%. If you want to go even deeper into the data, enjoy.
|
California Basic Aid districts and Minimum State Aid districts, 2022-23 |
||||||||
|---|---|---|---|---|---|---|---|---|
|
County |
Type |
District |
Sdts |
UD% |
Local |
State extra MSA $ |
Local extra $ per student |
State extra $ per student |
|
Alameda |
ELEM |
Mountain House Elementary |
20 |
74% |
92,161 |
196,668 |
4,726 |
10,086 |
|
Alpine |
UNIFIED |
Alpine County Unified |
86 |
62% |
275,084 |
476,520 |
3,202 |
5,546 |
|
Butte |
ELEM |
Golden Feather Union Elementary |
67 |
88% |
85,628 |
361,499 |
1,283 |
5,417 |
|
Calaveras |
ELEM |
Vallecito Union |
534 |
53% |
1,754,842 |
628,691 |
3,285 |
1,177 |
|
Calaveras |
HIGH |
Bret Harte Union High |
591 |
38% |
5,097,280 |
121,048 |
8,626 |
205 |
|
El Dorado |
ELEM |
Latrobe |
154 |
13% |
1,020,697 |
- |
6,646 |
698 |
|
El Dorado |
ELEM |
Silver Fork Elementary |
16 |
53% |
89,238 |
183,846 |
5,574 |
11,483 |
|
Fresno |
ELEM |
Big Creek Elementary |
36 |
84% |
387,502 |
212,212 |
10,681 |
5,849 |
|
Fresno |
ELEM |
Pine Ridge Elementary |
75 |
42% |
1,020,990 |
121,244 |
13,690 |
1,626 |
|
Inyo |
ELEM |
Round Valley Joint Elementary |
48 |
46% |
597,152 |
97,223 |
12,548 |
2,043 |
|
Inyo |
UNIFIED |
Big Pine Unified |
148 |
64% |
666,546 |
248,617 |
4,513 |
1,683 |
|
Inyo |
UNIFIED |
Lone Pine Unified |
340 |
65% |
673,110 |
445,343 |
1,981 |
1,311 |
|
Inyo |
UNIFIED |
Owens Valley Unified |
82 |
45% |
641,535 |
28,793 |
7,821 |
351 |
|
Kern |
ELEM |
General Shafter Elementary |
175 |
66% |
635,929 |
152,886 |
3,634 |
874 |
|
Kern |
ELEM |
Linns Valley-Poso Flat Union |
18 |
57% |
135,930 |
65,262 |
7,637 |
3,666 |
|
Kern |
ELEM |
McKittrick Elementary |
51 |
47% |
1,967,701 |
184,477 |
38,432 |
3,603 |
|
Kern |
ELEM |
Midway Elementary |
51 |
55% |
575,475 |
95,884 |
11,375 |
1,895 |
|
Los Angeles |
UNIFIED |
Beverly Hills Unified |
3,264 |
21% |
26,714,185 |
1,338,733 |
8,184 |
410 |
|
Los Angeles |
UNIFIED |
Santa Monica-Malibu Unified |
9,459 |
28% |
5,400,952 |
8,585,843 |
571 |
908 |
|
Marin |
ELEM |
Bolinas-Stinson Union |
93 |
43% |
2,827,080 |
229,708 |
30,514 |
2,479 |
|
Marin |
ELEM |
Mill Valley Elementary |
2,604 |
9% |
1,287,739 |
1,736,292 |
494 |
667 |
|
Marin |
ELEM |
Nicasio |
36 |
49% |
298,791 |
39,589 |
8,360 |
1,108 |
|
Marin |
ELEM |
Reed Union Elementary |
1,165 |
7% |
8,009,036 |
- |
6,875 |
- |
|
Marin |
ELEM |
Ross Elementary |
362 |
1% |
2,369,647 |
185,455 |
6,552 |
513 |
|
Marin |
ELEM |
Sausalito Marin City |
321 |
59% |
3,984,538 |
815,163 |
12,421 |
2,541 |
|
Marin |
HIGH |
Tamalpais Union High |
4,893 |
11% |
19,341,999 |
704,071 |
3,953 |
144 |
|
Marin |
UNIFIED |
Shoreline Unified |
370 |
63% |
6,033,131 |
877,629 |
16,287 |
2,369 |
|
Mendocino |
ELEM |
Manchester Union Elementary |
37 |
61% |
205,854 |
72,102 |
5,550 |
1,944 |
|
Mendocino |
HIGH |
Point Arena Joint Union High |
131 |
65% |
2,315,256 |
326,425 |
17,721 |
2,498 |
|
Mendocino |
UNIFIED |
Mendocino Unified |
401 |
54% |
1,161,698 |
1,556,031 |
2,899 |
3,883 |
|
Mono |
UNIFIED |
Eastern Sierra Unified |
393 |
53% |
3,591,356 |
959,729 |
9,132 |
2,440 |
|
Monterey |
UNIFIED |
Carmel Unified |
2,299 |
19% |
39,487,401 |
1,684,362 |
17,176 |
733 |
|
Monterey |
UNIFIED |
Pacific Grove Unified |
1,792 |
21% |
11,983,330 |
2,505,456 |
6,687 |
1,398 |
|
Napa |
ELEM |
Howell Mountain Elementary |
95 |
57% |
614,415 |
54,770 |
6,437 |
574 |
|
Napa |
ELEM |
Pope Valley Union Elementary |
51 |
84% |
761,081 |
73,930 |
14,911 |
1,448 |
|
Napa |
UNIFIED |
Calistoga Joint Unified |
824 |
82% |
6,776,722 |
508,956 |
8,228 |
618 |
|
Napa |
UNIFIED |
Saint Helena Unified |
1,148 |
44% |
23,465,062 |
481,492 |
20,442 |
419 |
|
Nevada |
ELEM |
Nevada City Elementary |
638 |
33% |
1,038,105 |
631,011 |
1,628 |
990 |
|
Orange |
UNIFIED |
Laguna Beach Unified |
2,629 |
18% |
38,545,395 |
548,204 |
14,663 |
209 |
|
Orange |
UNIFIED |
Newport-Mesa Unified |
18,535 |
45% |
124,718,168 |
7,634,726 |
6,729 |
412 |
|
Placer |
UNIFIED |
Tahoe-Truckee Unified |
3,664 |
36% |
20,711,853 |
1,906,330 |
5,652 |
520 |
|
Riverside |
UNIFIED |
Desert Center Unified |
25 |
84% |
1,199,773 |
120,493 |
47,838 |
4,804 |
|
San Benito |
ELEM |
Willow Grove Union Elementary |
16 |
94% |
68,358 |
22,963 |
4,307 |
1,447 |
|
San Benito |
UNIFIED |
Aromas - San Juan Unified |
937 |
59% |
1,060,437 |
1,560,937 |
1,132 |
1,666 |
|
San Bernardino |
ELEM |
Cucamonga Elementary |
2,331 |
71% |
10,802,323 |
2,130,982 |
4,634 |
914 |
|
San Bernardino |
UNIFIED |
Baker Valley Unified |
123 |
84% |
115,931 |
182,560 |
939 |
1,479 |
|
San Diego |
ELEM |
Cardiff Elementary |
608 |
16% |
4,381,838 |
386,643 |
7,204 |
636 |
|
San Diego |
ELEM |
Del Mar Union Elementary |
3,933 |
19% |
18,418,833 |
1,170,350 |
4,683 |
298 |
|
San Diego |
ELEM |
Encinitas Union Elementary |
4,908 |
19% |
8,827,772 |
1,840,774 |
1,799 |
375 |
|
San Diego |
ELEM |
Rancho Santa Fe Elementary |
566 |
9% |
5,671,672 |
157,463 |
10,014 |
278 |
|
San Diego |
ELEM |
Solana Beach Elementary |
2,815 |
20% |
20,282,502 |
1,663,990 |
7,205 |
591 |
|
San Diego |
HIGH |
Julian Union High |
96 |
52% |
457,033 |
347,758 |
4,750 |
3,614 |
|
San Luis Obispo |
ELEM |
Cayucos Elementary |
173 |
39% |
1,651,296 |
133,560 |
9,558 |
773 |
|
San Luis Obispo |
ELEM |
Pleasant Valley Joint Union Elementary |
54 |
36% |
243,244 |
124,441 |
4,471 |
2,287 |
|
San Luis Obispo |
UNIFIED |
Coast Unified |
525 |
77% |
3,663,493 |
623,045 |
6,984 |
1,188 |
|
San Luis Obispo |
UNIFIED |
San Luis Coastal Unified |
7,183 |
39% |
6,015,215 |
3,029,242 |
837 |
422 |
|
San Mateo |
ELEM |
Belmont-Redwood Shores Elementary |
4,043 |
16% |
1,878,302 |
253,946 |
465 |
63 |
|
San Mateo |
ELEM |
Brisbane Elementary |
442 |
27% |
4,664,344 |
182,688 |
10,544 |
413 |
|
San Mateo |
ELEM |
Hillsborough City Elementary |
1,235 |
4% |
12,772,173 |
172,044 |
10,344 |
139 |
|
San Mateo |
ELEM |
Las Lomitas Elementary |
1,055 |
13% |
14,157,348 |
264,400 |
13,414 |
251 |
|
San Mateo |
ELEM |
Menlo Park City Elementary |
2,595 |
13% |
15,133,234 |
432,027 |
5,832 |
166 |
|
San Mateo |
ELEM |
Portola Valley Elementary |
468 |
9% |
9,662,831 |
146,571 |
20,657 |
313 |
|
San Mateo |
ELEM |
San Bruno Park Elementary |
2,217 |
47% |
2,013,375 |
553,758 |
908 |
250 |
|
San Mateo |
ELEM |
San Carlos Elementary |
2,803 |
12% |
356,008 |
1,575,946 |
127 |
562 |
|
San Mateo |
ELEM |
San Mateo-Foster City |
10,775 |
41% |
6,452,223 |
7,821,366 |
599 |
726 |
|
San Mateo |
ELEM |
Woodside Elementary |
318 |
13% |
6,255,152 |
165,217 |
19,670 |
520 |
|
San Mateo |
HIGH |
Jefferson Union High |
3,946 |
37% |
3,978,680 |
2,752,472 |
1,008 |
698 |
|
San Mateo |
HIGH |
San Mateo Union High |
8,618 |
28% |
71,203,302 |
3,705,980 |
8,262 |
430 |
|
San Mateo |
HIGH |
Sequoia Union High |
8,253 |
32% |
72,848,088 |
3,369,327 |
8,827 |
408 |
|
San Mateo |
UNIFIED |
La Honda-Pescadero Unified |
274 |
58% |
1,129,155 |
213,482 |
4,125 |
780 |
|
San Mateo |
UNIFIED |
South San Francisco Unified |
7,776 |
45% |
29,490,038 |
3,356,626 |
3,793 |
432 |
|
Santa Barbara |
ELEM |
Ballard Elementary |
134 |
10% |
411,315 |
277,420 |
3,081 |
2,078 |
|
Santa Barbara |
ELEM |
Cold Spring Elementary |
185 |
5% |
2,499,103 |
90,129 |
13,509 |
487 |
|
Santa Barbara |
ELEM |
College Elementary |
169 |
60% |
2,345,042 |
501,743 |
13,898 |
2,974 |
|
Santa Barbara |
ELEM |
Goleta Union Elementary |
3,415 |
41% |
12,455,125 |
2,278,858 |
3,647 |
667 |
|
Santa Barbara |
ELEM |
Hope Elementary |
864 |
35% |
2,630,005 |
348,218 |
3,045 |
403 |
|
Santa Barbara |
ELEM |
Los Olivos Elementary |
158 |
25% |
319,857 |
247,660 |
2,022 |
1,566 |
|
Santa Barbara |
ELEM |
Montecito Union Elementary |
361 |
11% |
12,149,289 |
181,307 |
33,692 |
503 |
|
Santa Barbara |
ELEM |
Vista del Mar Union |
25 |
40% |
587,775 |
133,020 |
23,502 |
5,319 |
|
Santa Barbara |
HIGH |
Santa Ynez Valley Union High |
846 |
26% |
4,000,568 |
- |
4,732 |
- |
|
Santa Barbara |
UNIFIED |
Carpinteria Unified |
2,030 |
73% |
1,174,846 |
1,205,011 |
579 |
594 |
|
Santa Clara |
ELEM |
Campbell Union |
448 |
76% |
13,399,741 |
7,403,399 |
29,890 |
16,514 |
|
Santa Clara |
ELEM |
Lakeside Joint |
69 |
20% |
759,887 |
133,641 |
10,957 |
1,927 |
|
Santa Clara |
ELEM |
Loma Prieta Joint Union Elementary |
452 |
10% |
166,701 |
209,738 |
369 |
464 |
|
Santa Clara |
ELEM |
Los Altos Elementary |
3,688 |
14% |
13,123,844 |
654,207 |
3,558 |
177 |
|
Santa Clara |
ELEM |
Los Gatos Union Elementary |
2,754 |
9% |
8,827,300 |
121,495 |
3,206 |
44 |
|
Santa Clara |
ELEM |
Mountain View Whisman |
4,736 |
35% |
18,410,230 |
3,714,457 |
3,888 |
784 |
|
Santa Clara |
ELEM |
Orchard Elementary |
788 |
58% |
19,487 |
795,884 |
25 |
1,010 |
|
Santa Clara |
ELEM |
Saratoga Union Elementary |
1,640 |
9% |
18,250,617 |
324,666 |
11,132 |
198 |
|
Santa Clara |
ELEM |
Sunnyvale |
5,889 |
44% |
32,299,438 |
2,907,954 |
5,485 |
494 |
|
Santa Clara |
HIGH |
Campbell Union High |
8,371 |
36% |
4,610,652 |
3,827,724 |
551 |
457 |
|
Santa Clara |
HIGH |
Fremont Union High |
10,382 |
17% |
51,481,750 |
1,455,766 |
4,959 |
140 |
|
Santa Clara |
HIGH |
Los Gatos-Saratoga Union High |
3,344 |
8% |
20,325,848 |
150,691 |
6,079 |
45 |
|
Santa Clara |
HIGH |
Mountain View-Los Altos Union High |
4,196 |
16% |
50,612,441 |
2,979,534 |
12,061 |
710 |
|
Santa Clara |
UNIFIED |
Palo Alto Unified |
10,339 |
17% |
116,436,307 |
2,560,485 |
11,262 |
248 |
|
Santa Clara |
UNIFIED |
Santa Clara Unified |
14,220 |
46% |
116,396,229 |
9,818,349 |
8,185 |
690 |
|
Santa Cruz |
ELEM |
Bonny Doon Union Elementary |
127 |
18% |
536,043 |
117,428 |
4,225 |
926 |
|
Santa Cruz |
ELEM |
Happy Valley Elementary |
109 |
12% |
41,821 |
73,875 |
382 |
675 |
|
Santa Cruz |
ELEM |
Santa Cruz City Elementary |
1,832 |
42% |
9,072,761 |
1,104,695 |
4,953 |
603 |
|
Sonoma |
ELEM |
Alexander Valley Union Elementary |
108 |
29% |
678,844 |
298,328 |
6,301 |
2,769 |
|
Sonoma |
ELEM |
Forestville Union Elementary |
48 |
39% |
1,543,589 |
439,479 |
31,978 |
9,105 |
|
Sonoma |
ELEM |
Fort Ross Elementary |
13 |
65% |
179,867 |
72,066 |
13,585 |
5,443 |
|
Sonoma |
ELEM |
Guerneville Elementary |
24 |
60% |
307,010 |
471,540 |
13,064 |
20,066 |
|
Sonoma |
ELEM |
Horicon Elementary |
56 |
84% |
1,032,594 |
112,358 |
18,522 |
2,015 |
|
Sonoma |
ELEM |
Kenwood |
58 |
23% |
1,743,327 |
101,864 |
30,303 |
1,771 |
|
Sonoma |
ELEM |
Monte Rio Union Elementary |
69 |
73% |
353,287 |
129,882 |
5,150 |
1,893 |
|
Sonoma |
ELEM |
Montgomery Elementary |
20 |
56% |
255,422 |
91,797 |
12,848 |
4,618 |
|
Sonoma |
UNIFIED |
Geyserville Unified |
125 |
59% |
1,429,580 |
410,531 |
11,459 |
3,291 |
|
Sonoma |
UNIFIED |
Healdsburg Unified |
1,295 |
61% |
6,859,207 |
1,012,698 |
5,295 |
782 |
|
Sonoma |
UNIFIED |
Sonoma Valley Unified |
3,422 |
57% |
6,414,668 |
2,206,444 |
1,875 |
645 |
|
Tuolumne |
ELEM |
Twain Harte |
251 |
50% |
618,322 |
623,250 |
2,466 |
2,486 |
|
Tuolumne |
UNIFIED |
Big Oak Flat-Groveland Unified |
296 |
53% |
875,087 |
657,983 |
2,951 |
2,219 |
|
Source: CDE, 2022-23. Excludes County Offices of Education. |
||||||||
Tags on this post
Equity Funding LCFF Local funding Policy Property taxes District boundaries Prop 98All Tags
A-G requirements Absences Accountability Accreditation Achievement gap Administrators After school Algebra API Arts Assessment At-risk students Attendance Beacon links Bilingual education Bonds Brain Brown Act Budgets Bullying Burbank Business Career Carol Dweck Categorical funds Catholic schools Certification CHAMP Change Character Education Chart Charter schools Civics Class size CMOs Collective bargaining College Common core Community schools Contest Continuous Improvement Cost of education Counselors Creativity Crossword CSBA CTA Dashboard Data Dialogue District boundaries Districts Diversity Drawing DREAM Act Dyslexia EACH Early childhood Economic growth EdPrezi EdSource EdTech Education foundations Effort Election English learners Equity ESSA Ethnic studies Ethnic studies Evaluation rubric Expanded Learning Facilities Fake News Federal Federal policy Funding Gifted Grade inflation Graduation rates Grit Health Help Wanted History Home schools Homeless students Homework Hours of opportunity Humanities Independence Day Indignation Infrastructure Initiatives International Jargon Khan Academy Kindergarten LCAP LCFF Leaderboard Leadership Learning Litigation Lobbyists Local control Local funding Local governance Lottery Magnet schools Map Math Media Mental Health Mindfulness Mindset Motivation Myth Myths NAEP National comparisons NCLB Nutrition Pandemic Parcel taxes Parent Engagement Parent Leader Guide Parents peanut butter Pedagogy Pensions personalized Philanthropy PISA Planning Policy Politics population Poverty Preschool Prezi Private schools Prize Project-based learning Prop 13 Prop 98 Property taxes PTA Purpose of education puzzle Quality Race Rating Schools Reading Recruiting teachers Reform Religious education Religious schools Research Retaining teachers Rigor Rubrics School board School choice School Climate School Closures Science Serrano vs Priest Sex Ed Site Map Sleep Social-emotional learning Song Special ed Spending SPSA Standardized tests Standards Strike STRS Student motivation Student voice Success Suicide Summer Superintendent Suspensions Talent Taxes Teacher pay Teacher shortage Teachers Technology Technology in education Template Test scores Tests Time in school Time on task Trump Undocumented Unions Universal education Vaccination Values Vaping Video Volunteering Volunteers Vote Vouchers Winners Year in ReviewSharing is caring!
Password Reset
Search all lesson and blog content here.
Login with Email
We will send your Login Link to your email
address. Click on the link and you will be
logged into Ed100. No more passwords to
remember!


Questions & Comments
To comment or reply, please sign in .
Jeff Camp - Founder October 6, 2025 at 6:38 pm
Todd Maddison March 7, 2024 at 6:02 pm
This is the most awesomely comprehensive yet easy to read outline of what "Basic Aid" means that I've ever seen. My brain now hurts, but I feel like I have a much better understanding.
Thanks Ed100!