


The California School Dashboard for Graduation

Graduating from High School
Graduating from high school is an important milestone. According to the California Department of Education it officially represents "the completion of a broad and rigorous course of study." Every year about half a million young people in California emerge from their high school years, nearly 85% of them as high school graduates.
It makes sense for the state to keep track of graduation rates. Nearly one out of seven students in California doesn't finish high school, and those students are at elevated risk of having life take them in a variety of bad directions including homelessness, poor health and crime. These outcomes are hard on individuals and expensive for society, too. It's important to have meaningful ways to distinguish degrees of success and failure. When graduation rates improve, so do the chances of better outcomes for everyone.
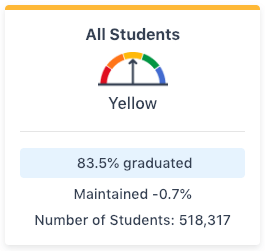
The California School Dashboard shines light on high school completion with the Graduation Rate indicator.
A Deceptively Difficult Measurement
Graduation rates are harder to calculate than you might imagine. It seems easy. Count the number of diplomas issued at the end of 12th grade (the numerator). Divide by the number that were enrolled at the beginning of 9th grade (the denominator). That's the graduation rate, right?
Yes, mostly. In about a third of California school districts, more than 95% of high school students graduate within four years. At that rate, the California school dashboard smiles its happiest color: boring blue.
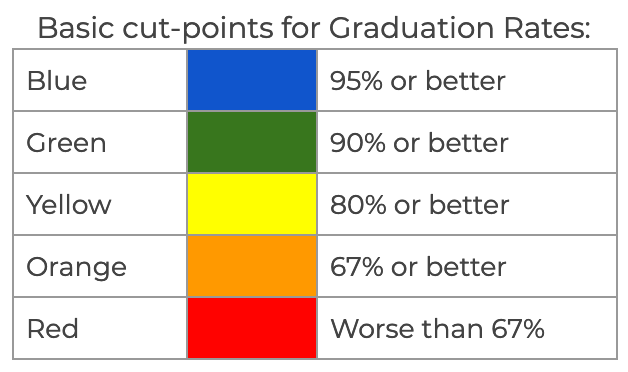
But the path through high school isn't always so direct. Before we delve into the weeds (and we will, a bit), it makes sense to start with an overview of the general case. Setting aside all the complicated cases, here are the basic cut points used by the graduation rate indicator of the Dashboard. If graduation rates are stable — that is, not getting significantly better or worse than last year — these are the basic levels:
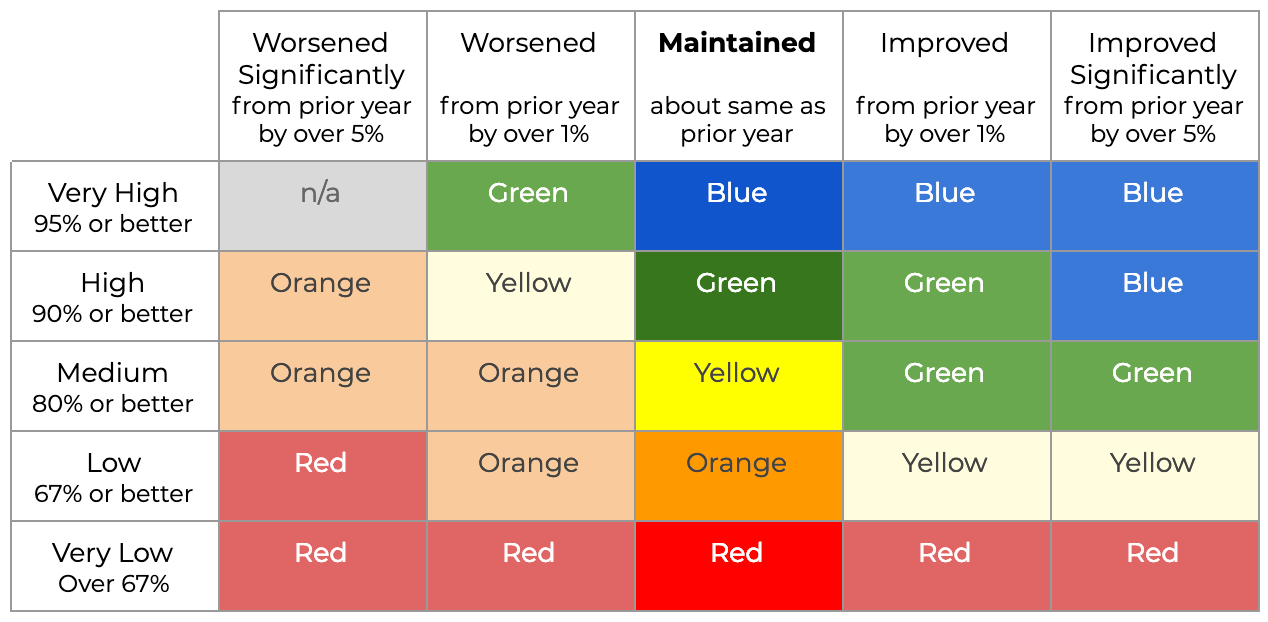
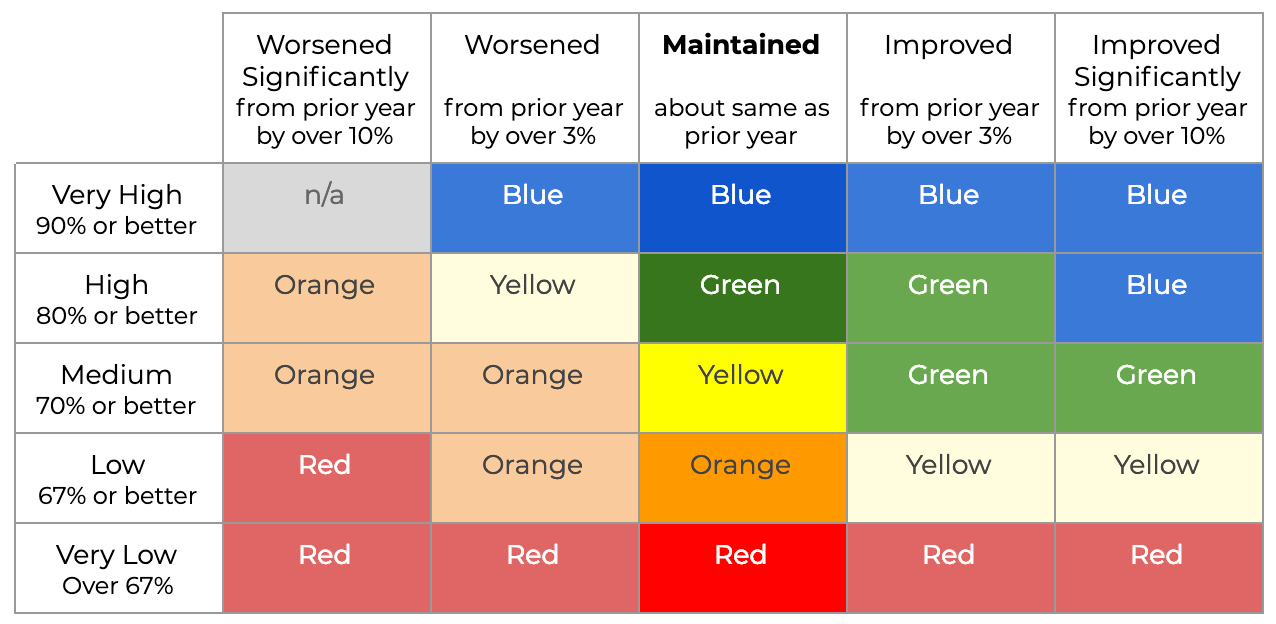
As with all indicators on the dashboard, the cut-points above aren't the end of the story because performance color is designed to reflect evidence of change. Where graduation rates are improving more than 1% year-on-year, the dashboard may assign a cooler performance color. The reverse is also true. In the table below, the middle column ("maintained") matches the cut-points above. The columns to the right reflect an improving trend; those to the left reflect a worsening trend.
Why Graduation Rates are Hard to Calculate
But there are endless exceptional cases, and it has taken years for Sacramento and Washington D.C. to come to agreement (mostly) about how to account for them.
|
Examples: Why Graduation Rates Are Hard to Calculate |
|
|---|---|
|
Suppose a student stops coming to school but passes a graduate-equivalent test like the GED or the CHPSE (California High School Proficiency Examination). Does the Dashboard count that student as contributing to the school's graduation rate? |
No, for the Dashboard's purposes a regular on-time diploma counts. Passing a test doesn't. |
|
If a student ends senior year a few credits short of a diploma, can she make up for it in summer school session? Does a student like that "count" for the school's graduation rate? |
Yes, but only if she meet the missing graduation requirements by August 15. |
|
If a student starts in high school A, transfers to high school B and graduates on time, how is he counted in California's graduation system? |
He is counted only once, as a graduate of school B, the last school where he was enrolled. |
|
What if a student starts in a California publiic high school but transfers to a private school? How is she counted in California's graduation rate system? |
California high school students who switch to private school are basically removed from the count altogether. The same approach applies for students who die or move out of state. Never happened. |
|
What if a student leaves traditional high school to attend a continuation high school? |
Ah, well there it gets complicated. Read on to the next section. |
To qualify for federal funds, each state has a data system capable of keeping track of students as they move from one school to another or from one district to another. In California this system is called CALPADS. (It stands for California Longitudinal Pupil Achievement Data System, but hardly anyone knows that. In this context, the word longitudinal indicates that the system can track individual students over time.)
The point of collecting this kind of data is to tell the difference between good and bad results and learn from them.
The Dashboard for Alternative High Schools
Here's the challenge: "good results" can depend on context. When a student is far behind grade level, or in trouble, or ill, or pregnant, just staying in school is a good result. Throughout California, school districts offer alternative schools and programs for students that need something different, like extra time or supports, or freedom to "do school" on a flexible schedule.
The California School Dashboard evaluates alternative high schools with a slightly different scorecard from traditional schools. School districts may apply for schools to be measured with Dashboard Alternative School Status (DASS), which applies more lenient cut-points for graduation rates above 67%.
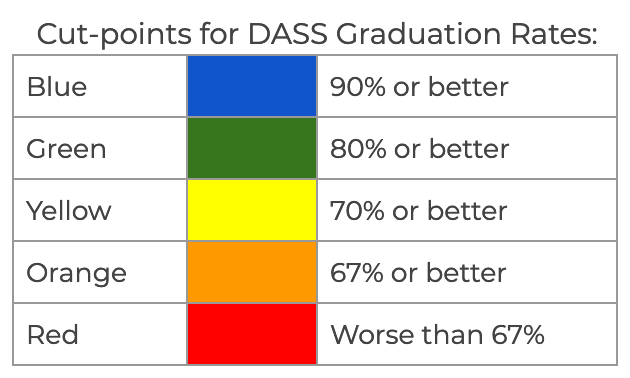
Similarly, the dashboard evaluates change (improvement or its opposite) with different cut-points for alternative high schools with DASS status:
Additional subtleties in the calculation of performance color are explained in the Department of Education's large and evolving California School Dashboard Technical Guide. (The web address for this guide tends to change with each update, but you can probably find the link through this page.) For example, in small districts the Dashboard calculates performance color using fewer cut points.
As of 2018, Dashboard Alternative status provides no "credit" for students that graduate from an alternative school after the August 15 cutoff date, but the Department of Education advised in the 2018 Technical Guide to expect this to change in 2019.
This post is part of a series about the California School Dashboard, the state's main tool for monitoring progress in the improvement of schools. If you don't understand the basics about the Dashboard — especially how it blends "status" and "change" — you might want to read this blog series from the start.
Context: Ed100 Lesson 9.7
Part 1: Overview
Part 2: The Indicators
Part 3: Performance Colors
Part 4: Math and English
Part 5: English Learners
Part 6: Attendance and Absenteeism
Part 7: Suspensions
Part 8: Graduation
Part 9: College and Career Success
Part 10: "Local" Indicators for School Districts
Tags on this post
Dashboard Graduation ratesAll Tags
A-G requirements Absences Accountability Accreditation Achievement gap Administrators After school Algebra API Arts Assessment At-risk students Attendance Beacon links Bilingual education Bonds Brain Brown Act Budgets Bullying Burbank Business Career Carol Dweck Categorical funds Catholic schools Certification CHAMP Change Character Education Chart Charter schools Civics Class size CMOs Collective bargaining College Common core Community schools Contest Continuous Improvement Cost of education Counselors Creativity Crossword CSBA CTA Dashboard Data Dialogue District boundaries Districts Diversity Drawing DREAM Act Dyslexia EACH Early childhood Economic growth EdPrezi EdSource EdTech Education foundations Effort Election English learners Equity ESSA Ethnic studies Ethnic studies Evaluation rubric Expanded Learning Facilities Fake News Federal Federal policy Funding Gifted Grade inflation Graduation rates Grit Health Help Wanted History Home schools Homeless students Homework Hours of opportunity Humanities Independence Day Indignation Infrastructure Initiatives International Jargon Khan Academy Kindergarten LCAP LCFF Leaderboard Leadership Learning Litigation Lobbyists Local control Local funding Local governance Lottery Magnet schools Map Math Media Mental Health Mindfulness Mindset Motivation Myth Myths NAEP National comparisons NCLB Nutrition Pandemic Parcel taxes Parent Engagement Parent Leader Guide Parents peanut butter Pedagogy Pensions personalized Philanthropy PISA Planning Policy Politics population Poverty Preschool Prezi Private schools Prize Project-based learning Prop 13 Prop 98 Property taxes PTA Purpose of education puzzle Quality Race Rating Schools Reading Recruiting teachers Reform Religious education Religious schools Research Retaining teachers Rigor Rubrics School board School choice School Climate School Closures Science Serrano vs Priest Sex Ed Site Map Sleep Social-emotional learning Song Special ed Spending SPSA Standardized tests Standards Strike STRS Student motivation Student voice Success Suicide Summer Superintendent Suspensions Talent Taxes Teacher pay Teacher shortage Teachers Technology Technology in education Template Test scores Tests Time in school Time on task Trump Undocumented Unions Universal education Vaccination Values Vaping Video Volunteering Volunteers Vote Vouchers Winners Year in ReviewSharing is caring!
Password Reset
Search all lesson and blog content here.
Login with Email
We will send your Login Link to your email
address. Click on the link and you will be
logged into Ed100. No more passwords to
remember!


Questions & Comments
To comment or reply, please sign in .